Propane Market Metrics: US manufacturing energy consumption
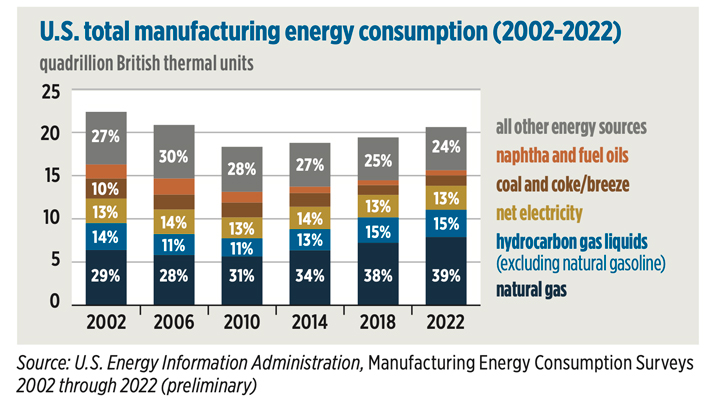
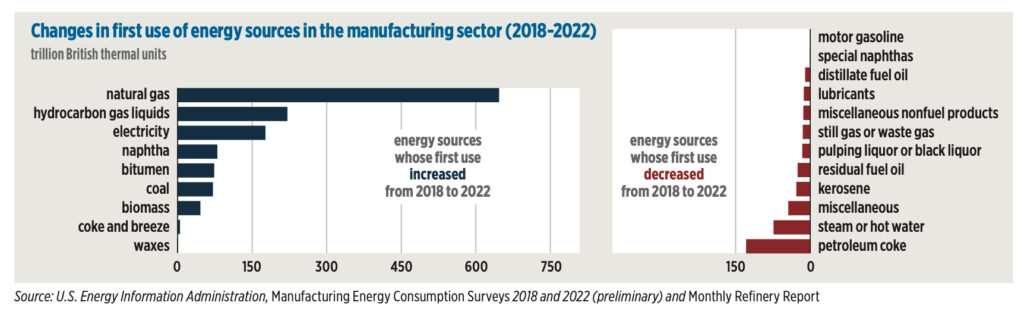
U.S. manufacturing energy consumption has continued to increase over the past three iterations since a low point in 2010, according to the U.S. Energy Information Administration’s (EIA) initial release of survey results for 2022. Natural gas consumption in the manufacturing sector increased by more than all other energy sources combined. Some manufacturers consume energy as both a fuel – for heat, power and electricity generation – and as a feedstock – a nonfuel or material input. First use of natural gas, hydrocarbon gas liquids (excluding natural gasoline) and electricity increased the most across the manufacturing sector from 2018 and 2022. By contrast, first use of petroleum coke and steam or hot water decreased.
Related Articles
Propane Market Metrics: US hydrocarbon gas liquid imports and exports
You May Also Like
P3 Propane Safety partners with Nationwide
Apr 23, 2025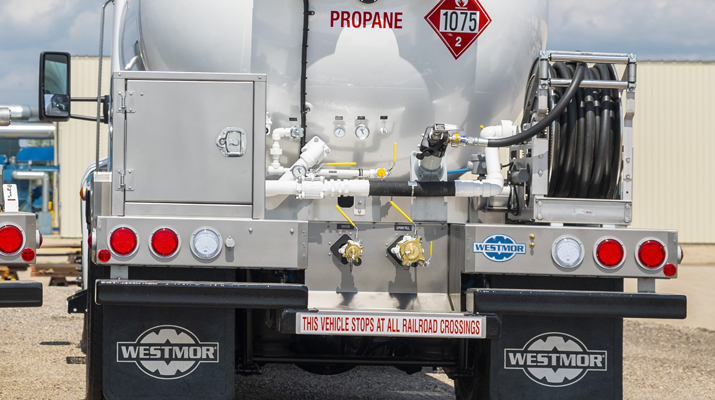
Westmor’s Ergoload Deck design celebrates 10 years
Apr 23, 2025
Faces & Places: April 2025
Apr 21, 2025


Subscribe to LP Gas
If you enjoyed this article, subscribe to LP Gas to receive more articles just like it.