Ready-for-sale propane data making an impact
Trader’s Corner, a weekly partnership with Cost Management Solutions, analyzes propane supply and pricing trends. This week, Mark Rachal, director of research and publications, revisits the ready-for-sale propane data point.
Catch up on last week’s Trader’s Corner here: Is it a new era for natural gas pricing?
In the March 18, 2024, Trader’s Corner, we introduced a new data point that the U.S. Energy Information Administration (EIA) was providing called ready-for-sale propane.
When we wrote that article, we said it would be a while before the industry would have enough history with the data point for it to make an impact. One year later, it has made an impact, so we are going to discuss the data point and provide new data.
What prompted this week’s article was that in client notes, a trader mentioned low ready-for-sale propane inventory and said he believed it would cause tightness in supply, maybe exacerbating an end-of-the-month short squeeze that would support prices. That was my cue for revisiting the ready-for-sale data point.
We have talked a lot recently about the process of obtaining propane supply. Propane comes from the process of producing crude and natural gas wells. The bulk of propane leaves production areas as part of a mix of natural gas liquids known as Y-grade. The Y-grade goes to the major process centers at Mont Belvieu, Texas, and Conway, Kansas, where most of the nation’s fractionation capacity resides.
There are large caverns upstream of fractionators that hold the Y-grade, and there are large caverns downstream of the fractionators that hold specification propane or ready-for-sale propane. Prior to the week ending on Feb. 23, 2024, the EIA did not distinguish between the propane on either side of the fractionator.
The propane inventory number of 43.349 million barrels still represents the combined fractionated and the estimated volume of non-fractionated propane in the Y-grade mix. But what we are about to explore is the new data point that is the volume of just fractionated propane, which, again, the EIA refers to as ready-for-sale propane.
What the aforementioned trader no doubt noticed was that ready-for-sale propane inventories ended the week of March 14 at 20.273 million barrels, just 46.77 percent of the 43.349 million barrels of total inventory. That put it at 6.306 million barrels lower than the same week last year. Just four weeks prior, ready-for-sale inventories were 2.491 million barrels more than last year. At that point, propane prices had started moderating, but the drawdown over the last three weeks has totally changed the pricing environment for propane from trending down to trending up.
Chart 1 provides the history of fractionated and non-fractionated propane inventories since the new data point became available.
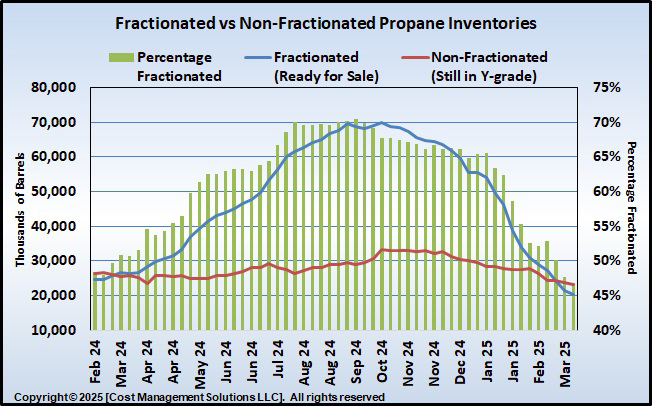
Let’s begin by looking at non-fractionated propane inventories or that portion that remains in Y-grade upstream of the fractionators. That amount stays fairly steady, which suggests that as Y-grade comes to the hubs, it is steadily processed by the fractionators on a year-round basis. We do not see a major accumulation of Y-grade at any particular point in the year.
The amount of propane inventory upstream of the fractionators has ranged from 23.076 million barrels to 33.337 million barrels. It is worth noting that that lowest level to date was the week ending March 14. That likely means that fractionators are running at full tilt trying to replenish ready-for-sale inventories. The highest-level propane in Y-grade was the week ending Oct. 13, 2024, which was the same week total propane inventories were setting the record high of 103.135 million barrels. Fractionators were likely throttling back at the point with so much ready-for-sale propane available.
Now for the fractionated inventory levels. The fractionated inventory level rose during summer months when domestic demand for it is lower and decreased once domestic demand picks up. Chart 2 is a demand chart corresponding to Chart 1.
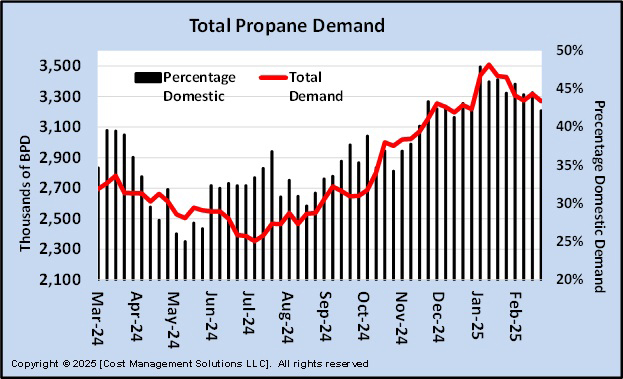
Chart 2 shows that overall propane demand is the lowest in the summer, allowing the ready-for-sale propane inventories to rise. After July, overall demand picks up as domestic demand begins to increase. You can see the percentage of domestic demand is generally rising during this period. Around October, the combination of export demand and increasing domestic demand reaches a high enough point to exceed U.S. production and imports, beginning the drawdown of the ready-for-sale inventory levels as can be seen in Chart 1.
Chart 3 compares current total demand to the previous two years.
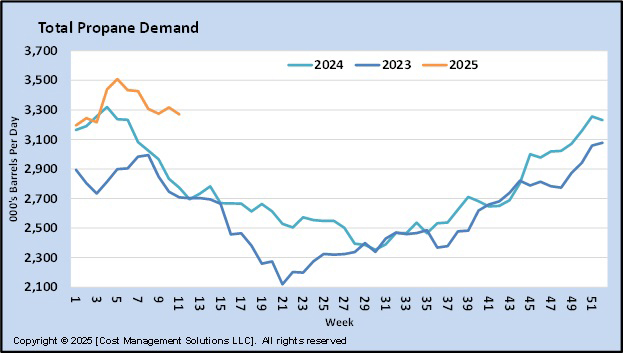
This demand is total demand, including both domestic and export. It is currently coming down, but the strong spike in demand, which Chart 2 shows, accompanied by a large increase in domestic demand during January, has put the pressure on ready-for-sale propane inventories.
Currently, propane prices are reflecting the tightness in ready-for-sale propane inventories caused by this spike in total demand that was primarily a result of the extreme cold in January that elevated domestic demand. U.S. propane production is increasing as fractionators try and replenish ready-for-sale inventories and demand is finally coming down. Though damage was done to inventory levels, it is likely to be transitory, leading to some softening in prices as the market sees ready-for-sale inventories replenish.
Remember, total inventory levels at the start of winter were at a record high of 103.135 million barrels. The hefty drawdown has total inventories currently at 8.858 million barrels below where it was at this point last year. Though this deficit may prevent inventories from reaching a new record before this coming winter, we would bet that the current 8.858-million-barrel deficit will be reduced by the start of next winter and the propane market will feel much better supplied than it currently feels.
With prices rising, it is easy for buyers to panic and lock in price protection for the future at unfavorable prices. When buyers act because they feel threatened, it usually doesn’t work out. Buying should be done when the market is providing an opportunity to price protect at numbers below the long-term price averages. For the most part, those opportunities aren’t currently out there, so it is best to wait for a good opportunity, rather than react to the current feeling of threat.
The market may not give us opportunities to buy price protection before next winter at favorable numbers if the tightness in supply is not corrected. Frankly, we would rather be short price protection going into next winter than react in a potentially overpriced market environment. Acting on opportunity has a good chance of working out for buyers; reacting when we feel threatened almost never does.
All charts courtesy of Cost Management Solutions
To subscribe to LP Gas’ weekly Trader’s Corner e-newsletter, click here.
You May Also Like
Trading versus hedging in propane futures
Apr 15, 2025
Far-out thoughts on buying propane
Apr 7, 2025


Subscribe to LP Gas
If you enjoyed this article, subscribe to LP Gas to receive more articles just like it.