Solving for the unknown in crazy April propane prices
Trader’s Corner, a weekly partnership with Cost Management Solutions, analyzes propane supply and pricing trends. This week, Mark Rachal, director of research and publications, examines the current propane forward price curve.
Catch up on last week’s Trader’s Corner here: Trading versus hedging in propane futures
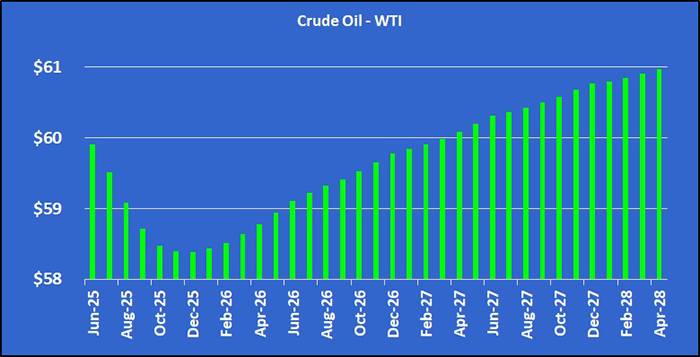
When we see a propane forward price curve like in Chart 1, it is obvious there is something amiss in the market.
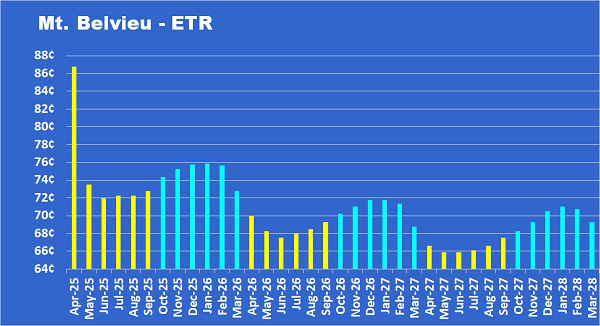
As we write on the morning of April 17, this is the current Mont Belieu ETR propane forward price curve. April 2025 MB ETR propane is 13.25 cents higher than May, and it is 17.75 cents above Conway April propane.
At 75 cents, the October 2025 to March 2026 propane price average is slightly inflated. The values set for the two winters after that aren’t bad. In fact, they are within the buy window. But April … my goodness, what is going on?
Something is obviously out of balance in the supply/demand equation, but is it supply, demand or both? We are going to try and solve the unknown in this equation and see if we can come up with an answer.
We will start on the supply side of the equation to see if the numbers are low there. The U.S. Energy Information Administration (EIA) collects data on propane production and imports. There are two categories of production. One is from refineries and blenders, which account for about 10 percent of U.S. propane production. The other is natural gas plant field production, which accounts for about 90 percent of supply. If one or both supply streams are having problems, it could cause a short-term shortage in the market. Given that the high price is contained to April, it appears traders believe whatever ails the market is short term in nature. Chart 2 shows total U.S. propane production.
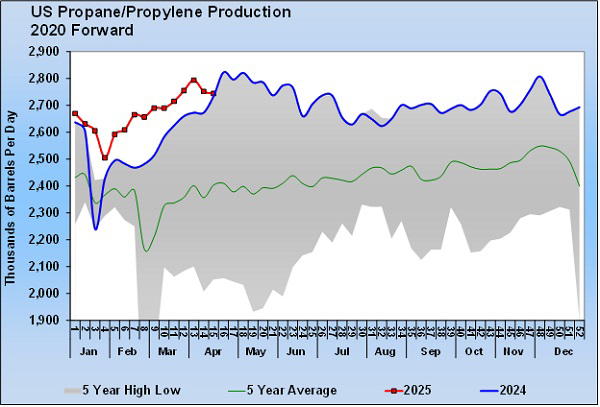
Propane production is down in the last couple of weeks but is equal to this time last year and near the five-year high. The problem is not that oil and gas wells and refiners are not producing propane. That part of the equation looks normal. So there should be plenty of propane upstream of the fractionators.
To save space, we are not going to provide a chart on propane imports, the other part of supply. Imports are a relatively small part of supply, running at only 99,000 barrels per day (bpd). That is equivalent to the five-year average for week 15 of the year. For the year, imports are running higher than last year. Conclusion: Propane imports are not the problem.
Even though supply is getting to the fractionators, U.S. propane inventories took a sudden nosedive last week, dropping 1.284 million barrels. Maybe fractionators are having problems? That wouldn’t really cause overall inventory to go down, though, because the inventories upstream of fractionators would be included. So even if fractionation rates dropped, inventories upstream of the fractionators would see a corresponding increase, and a build in overall inventories would likely occur. But overall inventories went down 1.284 million barrels.
Propane inventories upstream of the fractionators only increased 319,000 barrels. So only about 45,000 bpd of propane accumulated upstream of the fractionators. Refineries make about 250,000 bpd of propane. Total propane production last week was 2.744 million bpd. That means fractionators made 2.494 million bpd of spec propane while breaking down Y-grade. That means fractionators processed 98.2 percent of the propane that hit the Y-grade caverns upstream of them. It would seem fractionators are not the problem. That means the imbalance in the equation is not on the supply side. The imbalance must be created on the demand side.
Indeed, ready-for-sale propane inventories downstream of the fractionators declined 1.603 million bpd. That means demand exceeded 2.494 million bpd of fractionated propane, plus 250,000 bpd of spec propane from refiners and 99,000 bpd of propane imports (total 2.843 million bpd) and still needed to draw 229,000 bpd from spec propane inventories. That is a lot of demand for a week ending April 11.
What makes all of this even more perplexing is that during the same week last year ready-for-sale propane inventories increased 1.667 million barrels during the week ending April 12. That is a 3.27-million-barrel swing year-to-year in the ready-for-sale propane inventory for the 15th week of the year.
Now look at the difference in demand between the week ending April 12 last year and April 11 this year in Chart 3.
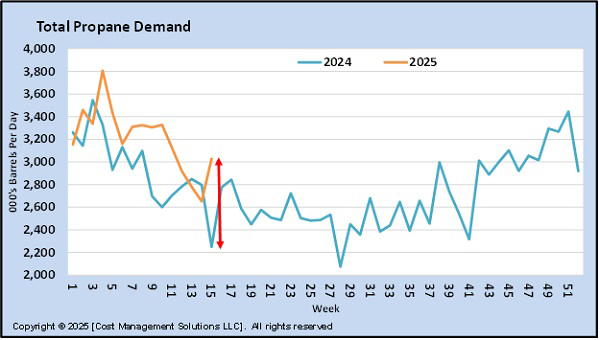
That is a 777,000-bpd difference in demand year-over-year between the same weeks of the year. Both domestic and export demand contributed. Domestic demand was 386,000 bpd more than the same week last year, and export demand was 391,000 bpd more than the same week last year.
Because there is a lot of weekly volatility in demand, we usually look at it on a four-week average. Chart 4 is the same chart of total demand using the four-week average.
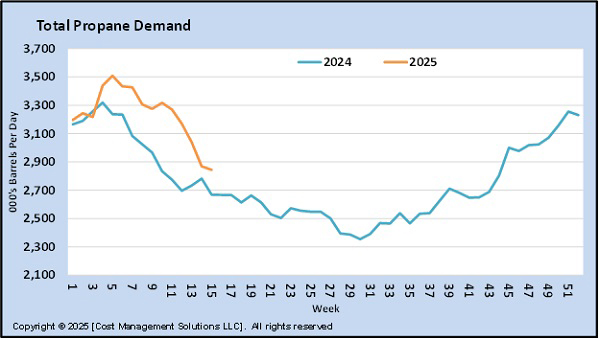
Using the four-week average shows just a 175,000-bpd difference in demand for the 15th week of the year. The four-week average does show a surge in demand back during the winter storm, but since then, demand has been trending largely like it did last year.
Even though we balanced the equation when looking specifically at the numbers reported by the EIA for the week ending April 11, it is hard to understand the answer to our question. Why would both domestic and export demand be so much higher from one year to the next?
As we have shown, weekly volatility is part of it. We have also speculated that buyers of U.S. propane for export could be buying a lot in April, trying to get cargoes delivered before their country imposes tariffs on the United States. That did not happen last year, and that could be an explanation for the dramatic year-over-year change. But where is all of the domestic demand during week 15 of the year coming from? That is a lot harder to explain.
Look, with ready-for-sale propane inventories 9.719 million barrels (32.5 percent) behind last year, we get why propane is trading higher. But, getting a grip on what is causing it is slippery. We think, at the least, the 1.603-million-barrel draw in ready-for-sale inventory for last week is inflated and probably should not be carrying the weight in the market it appears to have.
Complex equations like this are why we were force-promoted to a new grade each year after the seventh grade. It is little wonder that our answer is still lacking. But no worries, we will get promoted anyway.
All charts courtesy of Cost Management Solutions
To subscribe to LP Gas’ weekly Trader’s Corner e-newsletter, click here.
You May Also Like

LP Gas Hall of Fame takes the stage in Charlotte
May 16, 2025
25 deals that changed the propane industry
May 12, 2025
2024-25 merger and acquisition activity
May 9, 2025

Subscribe to LP Gas
If you enjoyed this article, subscribe to LP Gas to receive more articles just like it.